River Quality
Water is central to New Zealand’s social, economic and cultural well-being. It grows our food, powers our business and is highly valued for its recreational uses.
You can read about the latest LAWA National River Water Quality Summary results in the National Picture tab. Desktop and tablet users can view state and trends on the interactive map. After you’ve learned more about the national picture, click on the Regions tab to find out more on the water quality of your favourite sites.


Select an indicator:
- E. coli
- Clarity
- Dissolved Reactive Phosphorus
- Ammonia (toxicity)
- Nitrate (toxicity)
- Macroinvertebrate Community Index
View by:
LAWA River Health - National Picture 2024
Published: 22 September 2024
LAWA presents river health information for more than 1,500 sites throughout New Zealand. Rivers and streams are monitored for a range of water quality (chemical-physical and bacterial) and ecological indicators by regional councils and unitary authorities, and the National Institute of Water and Atmospheric Research (NIWA). State and trends for these indicators have been updated using data up to the end of June 2023.
This national picture summary focuses on the state of our rivers and streams. Here we report on six indicators:
A biological indicator of the health of wadeable rivers and streams:
-
Macroinvertebrate Community Index (MCI)
Indicators of water quality contributing to river ecosystem health:
-
Ammonia and nitrate toxicity - nutrients that can be toxic to in-stream life
-
Dissolved reactive phosphorus (DRP) - a nutrient that can lead to problematic in-stream algal growth
-
Clarity - a proxy for the impacts of suspended fine sediment that can affect river ecosystem health and the amenity value of waterways
An indicator of human health risk:
-
Escherichia coli (E. coli) - a bacterium that can indicate faecal contamination and the presence of harmful pathogens which may cause illness to recreational water users
This summary provides information on the state of river health in New Zealand, how it varies by land cover, and how it has changed over time. As data are only available for sites where monitoring has been conducted, and monitoring sites are often located in areas at greater risk of degradation from human activities, this summary is not necessarily a balanced representation of all rivers and streams across the country.
LAWA evaluates conditions (state) at sites nationwide against attribute bands described in the National Policy for Freshwater Management 2020 (NPS-FM 2020), from A (good) to D or E (poor). The 'current state' for 2023 at each site is based on monthly data over the previous five hydrological years (from 1 July 2018 to 30 June 2023). This LAWA evaluation requires an almost complete five-year history of monthly measurements before a grade can be assigned, not all river sites that feature on the LAWA website meet this requirement to be assigned attribute bands. See this factsheet for more information.
Current river health state
The current state of our rivers and streams varies by indicator (Figure 1).
Impaired ecological health is evident at almost two-thirds of monitored river sites, demonstrated by the proportion of MCI sites classified as attribute band C and D.
Dissolved reactive phosphorus (DRP) and water clarity (as a proxy for suspended fine sediment) are factors that contribute to river and stream ecosystem health. Just over half (52%) of the sites assessed for clarity are in the A band. However, around 38% of sites are in the C and D bands indicating that suspended fine sediment is potentially impacting aquatic life at some of these sites. For DRP, which is a nutrient that may contribute to excessive in-stream plant and algae growth, just over half of sites monitored are in band C or D. It is worth noting that some stream sites have naturally high levels of DRP, in some cases due to catchments with phosphorus-rich volcanic soils.
The risk of toxic effects of nitrate and ammonia on sensitive aquatic species is an issue at only a small percentage of monitored sites across the motu. Therefore, it is not likely that such toxicity is driving the widespread ecological health impairments we’re seeing through the MCI results.
Nitrogen can also stimulate problematic plant and algae growth in rivers at lower concentrations than those causing direct toxic effects. This plant growth can interact with other impacts of human activities that reduce habitat quality and the capacity of rivers to support aquatic life. Resource managers are required under the NPS-FM 2020 to manage the concentrations of dissolved nitrogen forms (collectively called dissolved inorganic nitrogen – DIN) and DRP to protect stream ecological health. These DIN concentrations are specific to the environmental characteristics of the river which they apply and therefore not included in this summary.
For New Zealand's primary indicator of faecal bacterial contamination (E. coli), two-thirds of monitored sites are graded band D or worse, indicating these sites are considered unsuitable for swimming from a public health risk perspective (i.e. the predicted average infection risk is greater than 3% on any given day).
LAWA National River Health Summary of State (2023)


Figure 1. Percentages of monitored sites by attribute bands for all six indicators discussed in this national picture summary. Bands were calculated over the five-year hydrological period (1 July 2018 – 30 June 2023). The number of sites with suitable data to determine an attribute band is shown for each indicator, and the monitoring site locations are shown on the map.
Current river health state by land cover
Land use is a key driver of water quality and river ecosystem health. In the following analyses we show differences in indicator state for 2023, among four different land cover categories, as defined by the River Environment Classification (REC) system.
There is a general pattern (Figures 2 – 7) among land cover categories for the six indicators that we are focusing on in this national summary, with the highest proportion of better scoring streams in native vegetation, followed by exotic forest, and then pasture. Urban streams generally receive the worst scores.
We note that approximately half the sites assessed for ammonia that are band C or D (below the national bottom line) within the pasture land cover class are in fact related to monitoring by a single council of specific point source discharges (such as wastewater discharges). These grades are not a reflection of activities undertaken in these broader catchments.
Rivers and streams with catchment cover that is classified as being predominantly native vegetation make up 48% of Aotearoa New Zealand’s stream length, while pastural catchments are also common making up 45%. Exotic forested stream catchments account for 5% of stream length and streams in urban catchments are less common at 1%. While urban streams only make up a small proportion of the country’s total river length, these waterways are important to our communities as almost 9 out of 10 New Zealanders live in urban areas, so many people’s local rivers and streams are currently in poor health.
The catchments in the native vegetation land cover class are least affected by human activities but are not necessarily 100% native vegetation. The land cover definition allows them to include some urban, pasture, and exotic forest in the catchment upstream, as long as they are still predominantly in native vegetation. Geological differences (different rock and soil types) among streams may also explain poor water quality. For example, phosphorus concentrations tend to be naturally high in catchments draining volcanic soils. Similarly, dissolved reactive phosphorus and ammonia can be elevated in wetlands and in streams draining high organic-content soils (e.g. peat soils). The combination of these factors may explain why some “native vegetation” sites are not always in the A band.
LAWA National River Health State (2023) by Land Cover Class
Macroinvertebrate Community Index (MCI)


Figure 2. Comparison of attribute bands for the Macroinvertebrate Community Index (MCI) across four land cover classes. Bands were calculated over the five-year hydrological period (1 July 2018 – 30 June 2023) at 1013 sites. The number of sites with suitable data to determine an attribute band for each land cover class is shown below each bar. The location and attribute band of these monitoring sites is shown on the map.
LAWA National River Health State (2023) by Land Cover Class
Ammonia (toxicity)


Figure 3. Comparison of attribute bands for ammonia (toxicity) across four different land cover classes. Bands were calculated over the five-year hydrological period (1 July 2018 – 30 June 2023) at 872 sites. The number of sites with suitable data to determine an attribute band for each land cover class is shown below each bar. The location and attribute band of these monitoring sites is shown on the map.
LAWA National River Health State (2023) by Land Cover Class
Nitrate (toxicity)


Figure 4. Comparison of attribute bands for nitrate (toxicity) across four different land cover classes. Bands were calculated over the five-year period (1 July 2018 – 30 June 2023) at 891 sites. The number of sites with suitable data to determine an attribute band for each land cover class is shown below each bar. The location and attribute band of these monitoring sites is shown on the map.
LAWA National River Health State (2023) by Land Cover Class
Dissolved Reactive Phosphorus (DRP)


Figure 5. Comparison of attribute bands for dissolved reactive phosphorus (DRP) across four different land cover classes. Bands were calculated over the five-year period (1 July 2018 – 30 June 2023) at 891 sites. The number of sites with suitable data to determine an attribute band for each land cover class is shown below each bar. The location and attribute band of these monitoring sites is shown on the map.
LAWA National River Health State (2023) by Land Cover Class
Clarity (Suspended Fine Sediment)


Figure 6. Comparison of attribute bands for clarity (as a proxy for suspended fine sediment) across four different land cover classes. Bands were calculated over the five-year hydrological period (1 July 2018 – 30 June 2023) at 447 sites and take into account the different suspended sediment classes defined in the NPS-FM 2020. The number of sites with suitable data to determine an attribute band for each land cover class is shown below each bar. The location and attribute band of these monitoring sites is shown on the map.
LAWA National River Health State (2023) by Land Cover Class
E. coli


Figure 7. Comparison of attribute bands for the faecal indicator bacteria E. coli across four different land cover classes. Bands were calculated over the five-year hydrological period (1 July 2018 – 30 June 2023) at 813 sites. The number of sites with suitable data to determine an attribute band for each land cover class is shown below each bar. The location and attribute band of these monitoring sites is shown on the map.
River health state over time
The above plots look at the current state, but how has state changed over time? To examine this, we identified sites that had an almost-complete sampling record over the last 15 years. This enabled us to calculate attribute bands for each five-year interval over the last decade. Each state band assessment is based on the previous five years of information, so the 2014 grades, for example, are based on a five-year hydrological dataset from 1 July 2009 – 30 June 2014. The following figures show results only for those sites that have this long and comprehensive sampling history.
At a national level, some indicators (e.g. dissolved reactive phosphorus, ammonia toxicity) show some signs of positive change over time with an increase in the proportion of sites in healthier attribute bands, while others (e.g. MCI) show some signs of worsening condition.
Macroinvertebrates are sampled to provide an indicator of the ecological health of wadeable streams and rivers. Species that are sensitive to poor water quality are only found at healthy river sites whereas species that are tolerant of poor water quality tend to dominate the macroinvertebrate community at polluted sites. The MCI summarises the pollution tolerances of the species that make up the community at a river site and these species respond to multiple drivers (e.g. physical habitat change, oxygen, climate change etc).
MCI shows a reduction in the number of sites in A and B bands, and more sites in C and D bands over the last 10 years (Figure 8). Sites graded in the D band are typically in lowland areas draining heavily modified catchments, while sites in the A-band are typically draining higher elevation areas with more natural land cover. An improvement in the MCI requires ecosystem-level improvements across habitat, water quality, water quantity, and ecological processes before sensitive species can return to these environments. This will take time. MCI may show a delayed response to actions taken to improve waterway health in the catchment, relative to some of the other indicators.
LAWA National River Health State Change Over Time (2014 - 2023)
Macroinvertebrate Community Index (MCI)


Figure 8. Changes in attribute bands for the Macroinvertebrate Community Index (MCI) from 2014 - 2023 at the 506 sites where there were enough data to determine a result each year. The location of these monitoring sites and current state attribute band (2023) is shown on the map.
Ammonia is one of several forms of nitrogen that exist in aquatic environments. In addition to contributing to growth of in-stream plant and algae biomass, at high concentrations ammonia is toxic to aquatic fauna. Most monitoring sites had low levels of ammonia where toxicity is unlikely but may still be at levels that contribute to excessive growth of plants or algae. There has been an increase in the proportion of sites in the A and B bands over the last 10 years (Figure 9).
LAWA National River Health State Change Over Time (2014 - 2023)
Ammonia (toxicity)


Figure 9. Changes in attribute bands for ammonia (toxicity) from 2014 - 2023 at the 395 sites where there were enough data to determine a result each year. The location of these monitoring sites and current state attribute band (2023) is shown on the map.
Nitrate is another of several forms of nitrogen present in aquatic environments, and like ammonia, it can contribute to growth of in-stream plant and algae biomass, but at high concentrations is toxic to aquatic fauna. Sites assessed as being in the A or B bands for in-stream toxicity effects can still have nitrate levels that increase the risk of excessive algal growth, because this occurs at much lower concentrations than toxicity. Most monitoring sites had levels of nitrate nitrogen that were below levels where toxicity is likely. The sites with potentially toxic (C and D band) concentrations of nitrate (which may affect sensitive species) are typically lowland spring-fed streams with flow dominated by inputs of high nitrate groundwater. The proportion of sites in each band has been very consistent over the last 10 years (Figure 10).
LAWA National River Health State Change Over Time (2014 - 2023)
Nitrate (toxicity)


Figure 10. Changes in attribute bands for nitrate (toxicity) from 2014 - 2023 at the 420 sites where there were enough data to determine a result each year. The location of these monitoring sites and current state attribute band (2023) is shown on the map.
Phosphorus is an important nutrient contributing to the growth of algae and other aquatic plants in freshwater systems, but when phosphorus concentrations are high there is an increased risk of nuisance algal blooms occurring. We often focus on dissolved reactive phosphorus (DRP) because that is the form of phosphorus that is most available for uptake by aquatic plants. The number of sites in the A and B bands have increased with a corresponding decrease in the D band over time (Figure 11). Sites with elevated DRP are typically in lowland areas draining heavily modified land and/or areas with naturally phosphorus-rich volcanic soils (more common in the North Island).
LAWA National River Health State Change Over Time (2014 - 2023)
Dissolved Reactive Phosphorus (DRP)


Figure 11. Changes in attribute bands for dissolved reactive phosphorus from 2014 - 2023 at the 419 sites where there were enough data to determine a result each year. The location of these monitoring sites is shown on the map
The amount of fine sediment suspended in the water is a key factor affecting water clarity. High concentrations of suspended sediment can also affect the feeding behaviour of some aquatic organisms (they can’t see their food), affect their ability to breathe (it clogs up their gills), and can reduce the amenity value (it can be less pleasant for people to swim in discoloured water). If sediment deposits on the stream bed it can influence habitat and food quantity/quality for aquatic life. Suspended fine sediment also often carries phosphorus with it.
Fine sediment can get into waterways through erosion and surface runoff from the land, erosion of stream banks, and from some discharges. Land use and management practices can have a big effect on erosion and run-off of fine sediment, but there are also natural differences in climate, geology, and slope which can influence sediment inputs to waterways. The NPS-FM 2020 recognises these natural differences by defining four different classes of stream based on their climate, geology and slope, which have different expectations in terms of water clarity state. There has been an increase in the proportion of sites in the A band and D band in the 141 sites that have a long monitoring record (Figure 12).
LAWA National River Health State Change Over Time (2014 - 2023)
Clarity (Suspended Fine Sediment)


Figure 12. Changes in attribute bands for clarity (suspended fine sediment) from 2014 - 2023 at the 141 sites where there were enough data to determine a result each year. The attribute bands take into account the differences in state expected for the four suspended sediment classes in the NPS-FM 2020. The location of these monitoring sites and current state attribute band (2023) is shown on the map.
E. coli is the main type of faecal indicator bacteria monitored in freshwater systems in New Zealand. High concentrations of E. coli indicate that there are significant sources of faecal matter upstream – such as stock inputs, runoff, birds, or untreated wastewater discharges. High levels of faecal indicator bacteria in river water are a concern as they suggest other harmful bacteria or pathogens may be in the water, which could make us sick.
E. coli monitoring is conducted at popular swimming sites during the summer as well as year-round regardless of the flow conditions at State of the Environment monitoring sites. The data presented here are from the State of the Environment sites only and show that around two-thirds of these sites are scoring poorly and are in the D and E bands. This has been a relatively consistent picture over the last 10 years with some indication of a reduction in the proportion of A band sites and an increase in the proportion of D band sites (Figure 13). Sites in the D and E band are typically in lowland areas draining heavily modified catchments.
LAWA National River Health State Change Over Time (2014 - 2023)
E. coli


Figure 13. Changes in attribute bands for the faecal indicator bacteria E. coli from 2014 - 2023 at the 325 sites where there were enough data to determine a result each year. The location of these monitoring sites and current state attribute band (2023) is shown on the map.
River health monitoring and reporting
This National Picture provides an aggregated overview of the state of river and stream health across six indicators using data from regional councils, unitary authorities, and NIWA.
Understanding the changing health of our rivers and streams is reliant on high quality data from long-term monitoring programmes. State of the Environment river health monitoring data on LAWA is available from 2004 onwards, and there are over 1.8 million records for water quality and macroinvertebrate monitoring. These numbers represent the huge collective effort and investment by regional councils, unitary authorities, research agencies and others. In recent times, monitoring staff across the country have worked hard to get back to sampling as soon as possible through COVID-19 lockdowns and extreme weather events. In some cases, these challenges have created gaps in our long-term data which we openly acknowledge and do our best to minimise the impact of.
As a project, we are working to align our reporting with national legislation and include information on a wider variety of indicators as long-term monitoring data becomes increasingly available over time. There will be a broader range of indicators available to better understand the health of our rivers as councils introduce changes to their monitoring network to better respond to up-and-coming legislative requirements, such as being able to report on ecosystem health, human contact, mahinga kai, and threatened species. Once more indicators are available, we will be able to provide a more holistic ‘health check’, and integrate assessments of rivers, lakes, groundwater, and estuaries.
LAWA Project partners are working hard to improve the consistency of monitoring across New Zealand through the development and use of National Environmental Monitoring Standards (NEMS). As these standards are implemented, we expect to see further improvements in the availability of high-quality data on our environment.
Monitoring to inform actions and track progress
There is a lot of work underway to restore the health of our waterways. However, there can be a long lag time between actions people undertake to help the environment, and the resulting environmental change that can be detected and reported on in our rivers and lakes. Keeping track of land management actions to improve our waterways provides a more immediate indicator of progress towards catchments that support freshwater health, but data has typically been unavailable or difficult to access at a national level.
Actions for Healthy Waterways will be the next topic to launch on the LAWA website. This topic will report on the restorative or protective actions that people are making to improve waterway health in catchments. By gathering and reporting on this information we will be better able to link the actions that have been done on the land, to the water quality outcomes being sought, and better understand which actions work best to inform future efforts.
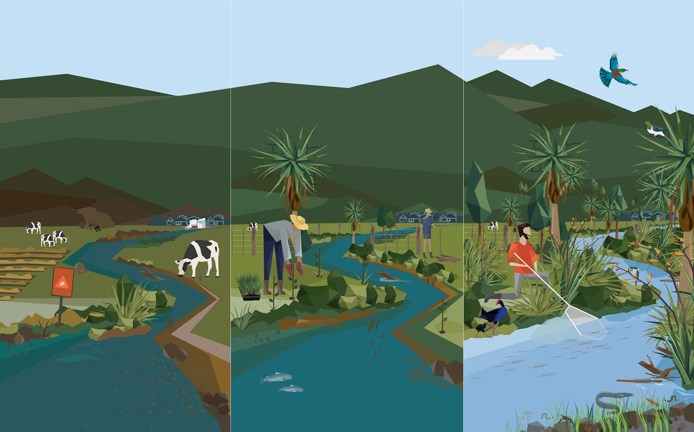
Figure 14. An infographic showing a river journey towards restored ecosystem health. The river under pressure with poor ecosystem health (left panel), actions underway to improve river health (middle panel), and a future state moving towards a thriving river ecosystem (right panel).
Explore more on LAWA
Looking at individual site data alongside contextual information at a catchment and regional level is useful for mana whenua, community groups, landowners, and others interested in how local waterways are tracking. Information specific to monitored sites can be accessed either by clicking on a site dot on the map to the left of the LAWA main screen (desktop and tablet users), or by navigating menus to the region, then catchment, and then site of interest. The organisation responsible for monitoring an individual site can provide further contextual information to the results shown.