Lake Quality
Aotearoa’s lakes are treasured for their cultural, recreational, ecological, and economic value. For Māori, fresh water is a taonga - essential to life and identity. Lakes also support native wildlife, tourism, agriculture, and hydroelectricity.
While some lakes are in excellent condition, others face significant water quality challenges.
Explore the National Picture for a summary of the latest results across the country, or visit the Regions tab to check water quality at lakes near you. Desktop and tablet users can also view monitored lake information using the interactive map.


Select an indicator:
- TLI
- Total Phosphorus
- Ammonia (Toxicity)
- Total Nitrogen
- Chlorophyll a
- Cyanobacteria
- E. coli
- Secchi disc
View by:
Select trend period:
- 10 years
- 15 years
- 20 years
LAWA Lake Health - National Picture 2025
Published: 28 September 2025
Why lake health matters
Healthy lakes are vital for our ecosystems, our communities, and our way of life. They:
-
provide clean water for people, plants, and animals
-
support mahinga kai, biodiversity, and recreation
-
play an important role in tourism, agriculture, and hydroelectricity generation
-
reflect how land and water are being managed
What is monitored and shown on LAWA?
LAWA provides information on the health of 137 lakes across New Zealand. Some lakes are monitored at multiple sites, with data from around 200 locations. For the first time, this includes Chatham Islands lakes, along with 20-year trends analyses for some sites.
Monitoring is carried out by regional councils and unitary authorities, and Earth Sciences New Zealand (formerly NIWA) for a range of water quality and ecological indicators, including chemical, physical, bacterial and ecosystem health measurements. The latest state and trend results use data collected up to June 2024.
This national picture summary reports on the condition of monitored lakes using the following key indicators:
Overall lake condition:
-
Trophic Level Index (TLI) – a measure which combines chlorophyll a, total phosphorus, total nitrogen and water clarity (Secchi disc depth). To compare lakes nationally, the TLI here is calculated using three measurements consistently available: chlorophyll a, total phosphorus, and total nitrogen.
Aquatic life:
-
Chlorophyll a – a measure of the amount of phytoplankton (algae) in water. High levels affect water quality and aquatic ecosystems.
Water quality indicators contributing to lake health:
-
Total phosphorus and total nitrogen – nutrients that can lead to elevated plant and algae growth.
-
Clarity – how clear the water is. A measure of how much light is available to aquatic life.
-
Ammonia toxicity – a nutrient that can harm fish and other aquatic life at high levels.
What does the national picture cover?
This summary looks at:
-
the current state of monitored lakes across New Zealand
-
how lake health has changed over time
This summary only includes lakes with long-term, high-quality data that meets monitoring standards. Many of the lakes with the best data are in areas where human activity has had a noticeable impact, or where social and cultural values have motivated regular sampling. As such, the results are not a national representation of all lakes in New Zealand. That said, we can learn a lot from the monitoring histories of the lakes that are regularly monitored.
How are the results graded?
LAWA reports overall lake condition using the Trophic Level Index (TLI). TLI scores are calculated each hydrological year and represent categories ranging from ‘very good’ to ‘very poor’. Low TLI scores indicate better water quality, and higher scores indicate progressively poorer water quality.
Data are analysed by hydrological year (July to June), to reflect seasonal lake dynamics, such as summer algae growth and lake stratification.
LAWA also uses attribute bands from the National Policy Statement for Freshwater Management 2020 (NPS-FM 2020) to grade lakes from A (good) to D (poor) for indicators of water quality and aquatic life. 'Current state' for 2024, are based on five years of data (from 1 July 2019 to 30 June 2024), using monthly or quarterly measurements. Only sites with enough data were assigned an attribute band. Note: There are no NPS-FM attribute bands for clarity, so LAWA uses the same clarity categories used in TLI assessments, based on Secchi disc depth.
For more detail, see our factsheets on TLI and calculating state for lake water quality attributes.
Lake health current state
Trophic Level Index (TLI)
The TLI provides an integrated measure of lake condition. In this section, we present TLI results and compare upland versus lowland lakes, and shallow lakes versus deeper lakes.
National overview (Figure 1):
-
Of the 137 lakes monitored, 34 lakes (25%) are classified as being in 'very good', 'good' or 'fair' condition.
-
The remaining 103 lakes (75%) are classified as being in 'very poor' or 'poor' condition.
Between 2023 and 2024, the number of lakes included in reporting decreased from 160 to 137. This change is due to:
-
The exclusion of some lakes – many from high country areas that historically were classified as fair to very good condition – that did not meet data quality standards this year.
-
The addition of lakes in the Chatham Islands for the first time.
The change in the monitoring dataset contributed to the overall reported decline in lake condition, as a higher proportion of lakes with poorer water quality were included this year.
LAWA National Lake Trophic Level Index (2024)
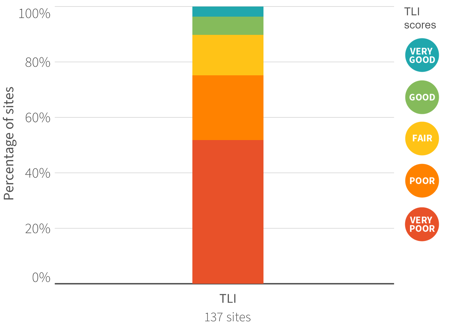
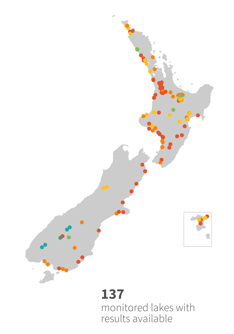
Figure 1. Trophic Level Index (TLI) scores for 137 monitored lakes with sufficient data for the hydrological year (July 2023–June 2024). The map shows the location of these lakes and their associated TLI scores.
Landscape matters: altitude and depth
A lake’s health is influenced by its position in the landscape:
-
Lowland lakes are often shallow and located in catchments with higher levels of agricultural, urban development, or other land use pressures.
-
Upland lakes are typically deeper and face fewer human pressures (e.g., urbanisation, farming).
Currently, about two-thirds of the lakes reported on are lowland shallow lakes.
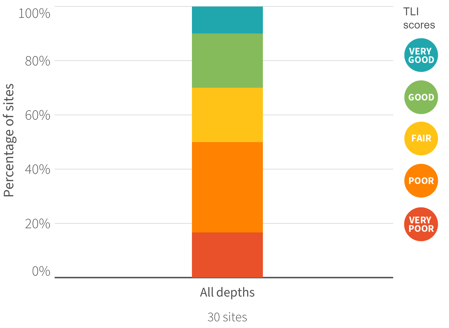
Key findings (Figure 2):
-
Upland lakes are generally in better condition than lowland lakes.
-
Deep lakes tend to be in better condition than our shallow lakes.
This means that the biggest challenges with lake health are in our lowland shallow lakes where 68 monitored lakes (91%) were in 'very poor' or 'poor' health. In contrast, 15 monitored upland deep lakes (50%) are in 'very good', 'good' or 'fair' health.
Trophic Level Index (2024) by altitude and depth
Upland lakes (altitude >170 m)
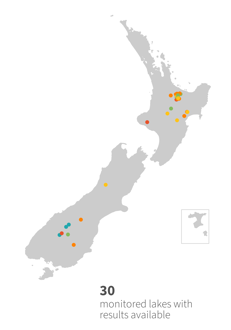
Lowland lakes (altitude <170 m)
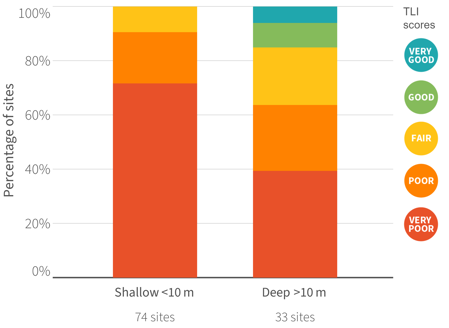
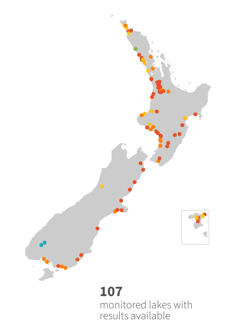
Figure 2. Comparison of Trophic Level Index (TLI) scores by lake altitude and depth. TLI was calculated from data collected during the hydrological year (July 2023–June 2024). The number of monitored lakes is shown by altitude (upland > 170 m or lowland < 170 m) and depth category (shallow <10 m and deep > 10 m). The maps show the location of these lakes and their associated TLI scores.
Indicators of aquatic life and water quality
In this section we assess current state for 2024 by five indicators of aquatic life and water quality: chlorophyll a, total nitrogen, total phosphorus, ammonia toxicity, and clarity.
What do the bands mean?
-
Band A: Lakes are expected to have healthy and resilient ecological communities.
-
Band B: Lakes are slightly impacted by algal and plant growth arising from elevated nutrient concentrations.
-
Band C: Lake ecological communities are moderately impacted by algal and plant growth arising from elevated nutrient concentrations, with subsequent reduced water clarity; the most sensitive species start to be occasionally impacted by ammonia (toxicity).
-
Band D: Indicates lakes in a degraded state due to impacts of elevated nutrients, excessive algal growth and potential loss of oxygen from water at the bottom of lakes; the most sensitive species start to be regularly impacted by ammonia (toxicity).
Current state of lake health (2024)
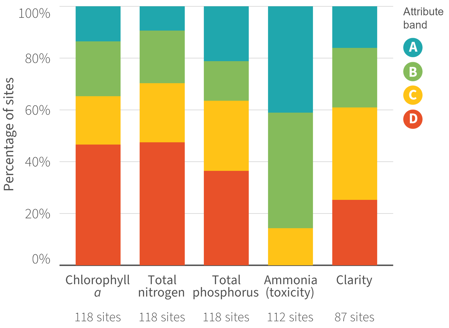
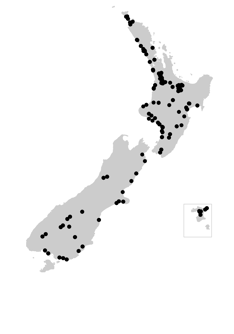
Figure 3. Attribute band results for five indicators of water quality and aquatic life across New Zealand. Each bar shows the percentage of monitored lakes in each band, based on five years of data (July 2019–June 2024). The number of sites with suitable data to determine an attribute band for each indicator is shown below each bar, and their locations are shown on the map. Note: Clarity is not included in NPS-FM 2020 attribute bands, so LAWA uses TLI-based clarity bands (Secchi depth grades).
Indicator highlights (Figure 3)
Chlorophyll a is the green pigment used in photosynthesis and is a reliable indicator of the total amount (or biomass) of phytoplankton (algae) in a lake.
-
Over 65% of monitored lakes (77 lakes) were in C and D bands, indicating that their ecological communities are impacted by algal and plant growth arising from elevated nutrient concentrations, with subsequent reduced water clarity. Lakes in band D may have shifted – or are at risk of shifting – to a persistent degraded state.
Total nitrogen and total phosphorus are important nutrients for the growth of algae and aquatic plants in freshwater systems, but high levels cause eutrophication, leading to algal blooms and lakes shifting to a degraded, turbid state without aquatic plant cover.
-
Around 65% of assessed lakes (75 for phosphorus, 83 for nitrogen) were in band C or D, suggesting these lakes are impacted by nutrient enrichment, with lakes in the D band already in a degraded state.
Ammonia (toxicity): ammonia is one of several forms of nitrogen that can have enriching effects in the ecosystem but can be toxic at high levels.
-
Over 85% of monitored lakes (96 lakes) are in bands A or B, where toxicity risks are low.
-
16 lakes are in band C, indicating potential harm to sensitive species.
Clarity affects how much light reaches underwater plants and algae. Water clarity may be reduced when there is an increase in suspended sediment or phytoplankton (algae) in the water. Low clarity commonly occurs with nutrient enrichment.
-
More than 60% of monitored lakes (53 lakes) were in band C or D, suggesting these lakes are impacted by nutrient enrichment.
Some lakes naturally have lower clarity; these include tannin enriched forest lakes (e.g. Lake Brunner), peat lakes, or lakes with fine inorganic sediment through natural erosion processes (e.g. Lake Pukaki’s iconic bright blue water comes from glacial flour).
Lake health state over time
The above plots illustrate the current lake state or condition, but how has this changed over time?
The following figures show results for sites that have a long and comprehensive sampling history, allowing comparisons from the same set of sites over time.
Trophic Level Index (TLI) change
TLI scores are available for 81 lakes over the past 10 years.
-
Nationally, lake TLI scores show with a slight increase in the proportion of ‘very poor’ and ‘poor' lakes over the last decade (Figure 4).
Note: The TLI dataset this year excluded many lakes from high country areas that have historically had TLI scores in the ‘fair’ to ‘very good’ categories. This means a higher proportion of lakes with overall poorer condition have been reported.
Trophic Level Index change over time (2015-2024)
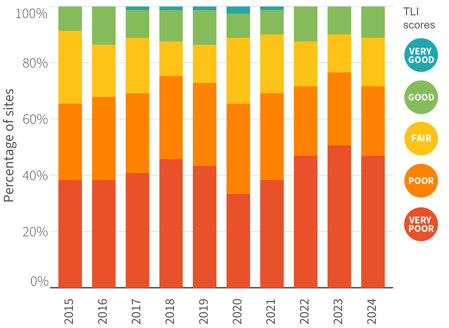
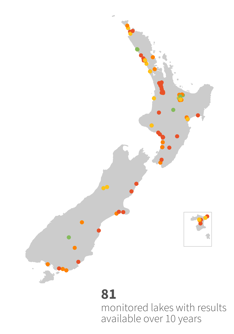
Figure 4. Changes in Trophic Level Index (TLI) scores from 2015-2024 at 81 lakes where there were enough data to determine a TLI score each year. The location of these lakes and their current TLI scores (2024) are shown on the map.
Aquatic life and water quality indicator changes over time
To understand long-term changes for these indicators, we analysed sites with a near-complete sampling record over the last 15 years. This enabled us to calculate state attribute bands for each five-year interval over the last decade (2015-2024). For example, results for 2015 are based on data collected over five hydrological years from July 2010–June 2015. This allows us to compare how the same set of lake sites have changed over time.
Chlorophyll a
-
For chlorophyll a there has been an increase in the number of lakes in bands C and D over the last 10 years (Figure 5).
Chlorophyll a responds to increases in nutrients in the ecosystem (nitrogen and phosphorus), and improvements in this indicator usually require improvements in the nutrient indicators.
State change over time (2015-2024): chlorophyll a
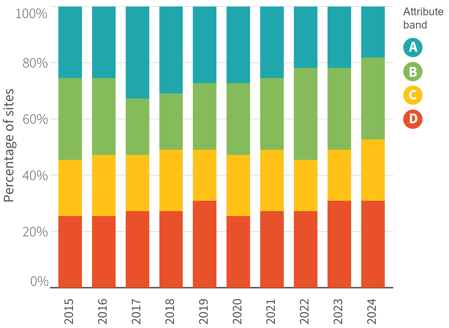
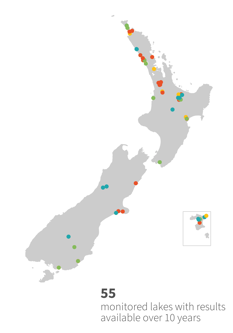
Figure 5. Changes in attribute bands for chlorophyll a, from 2015-2024 at the 55 monitored lakes where there were enough data to determine a band each year. The location of these lakes and the current attribute band (2024) are shown on the map.
Total phosphorus
-
For total phosphorus there has been an increase in the number of monitored lakes in band A and in band C, over the last 10 years (Figure 6).
Phosphorus is often bound within the lakebed sediment, from where it can be released at a later stage in response to changes in ecosystem conditions and weather events. For this reason, improvements in this indicator may show ups and downs over time. Phosphorus is also often delivered to lakes attached to sediment, so high rainfall events can drive phosphorus inputs to lakes. Climatic cycles, such as ENSO (El Niño-Southern Oscillation) are drivers of phosphorus dynamics, particularly in sub-alpine, low nutrient lakes. Total phosphorus can persist in lake sediments for decades after reductions in inflow concentrations have occurred, therefore lake restoration can be a slow process.
State change over time (2015-2024): total phosphorus
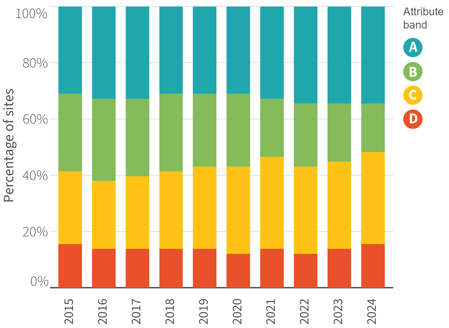
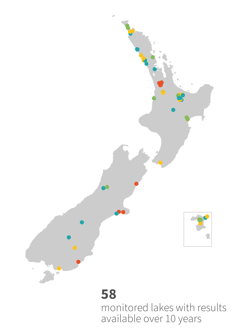
Figure 6. Changes in attribute bands for total phosphorus, from 2015-2024 at the 58 monitored lakes where there were enough data to determine a band each year. The location of these lakes and the current attribute band (2024) are shown on the map.
Total nitrogen
-
For total nitrogen the number of lakes in the C and D bands has been relatively consistent over the last 10 years (Figure 7). However, the number of sites in band A has decreased. That means our low-nutrient lakes are becoming more enriched with nitrogen.
Total nitrogen can contribute to the excessive growth of phytoplankton (algae), reducing water clarity. Improvements in this indicator can contribute to improvements in chlorophyll a and, to a lesser extent, ammonia.
State change over time (2015-2024): total nitrogen
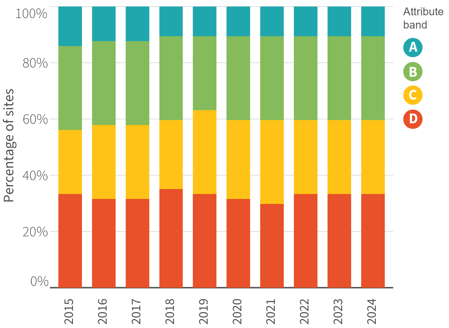
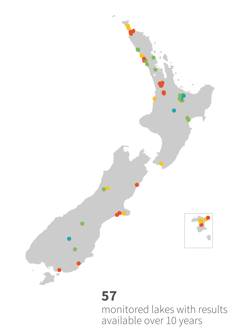
Figure 7. Changes in attribute bands for total nitrogen, from 2015-2024 at the 57 monitored lakes where there were enough data to determine a band each year. The location of these lakes and the current attribute band (2024) are shown on the map.
Ammonia (toxicity)
-
For ammonia (toxicity) there are currently no lakes that have been monitored consistently over the last 10 years that show concentrations approaching the acute impact level (that is, risk of death) for sensitive species (D band).
-
However, approximately 11% of the lakes are still in the C band where there can be regular impacts on the most sensitive species (Figure 8).
State change over time (2015-2024): ammonia (toxicity)
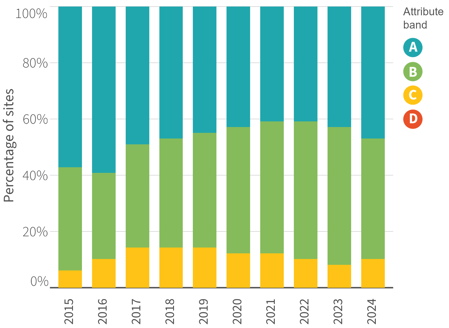
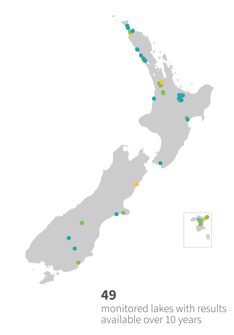
Figure 8. Changes in attribute bands for ammonia (toxicity), from 2015–2024 at the 49 lakes where there were enough data to determine a band each year. The location of these lakes and the current attribute band (2024) are shown on the map.
Analysis of state change over time for clarity generated only a limited number of lakes with results available over 10 years, therefore it is not reported in the national summary.
Lake health monitoring and reporting
The role of long-term monitoring
Understanding how lake health is changing over time relies on high quality data from long-term monitoring programmes. LAWA publishes State of the Environment lake health data from 2004 onwards, covering indicators of lake condition, water quality and aquatic life. There are around 140,000 monitoring records in the LAWA lakes dataset, which reflects a significant effort and investment by regional councils, unitary authorities, research agencies, and others. While extreme weather events and other challenges (e.g. COVID lock-downs) have occasionally created data gaps, these are openly acknowledged and carefully managed to minimise their impact.
Moving toward a more complete picture
Healthy lakes have high ecological value. They support a thriving community of plants and animals. Healthy lakes also have high social value. They can be used for mahinga kai and provide recreational activities opportunities (walking, swimming, sailing, and places for connection).
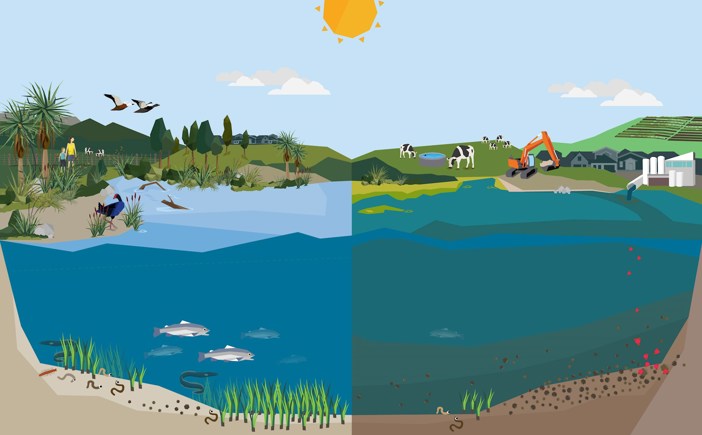
Figure 9. A graphic example of a lake with good ecosystem health (left panel) versus a lake under pressure with poor ecosystem health (right panel).
There are numerous initiatives underway to improve water quality in New Zealand lakes. Gathering data regarding when and why changes have occurred is essential to set goals for restoration projects and to identify which lakes are in most need of protection.
As long-term datasets grow, the LAWA project will continue working to align reporting with national environmental legislation and look for opportunities to include a wider variety of indicators.
Supporting consistency through national standards
LAWA project partners are also working to improve the consistency of environmental monitoring across New Zealand. This includes the development and use of National Environmental Monitoring Standards (NEMS).
As part of the state and trend analysis, lower-quality data are excluded - either through a council’s internal coding systems or via national best practice standards under the NEMS Quality Coding framework. As more organisations adopt these standards, we expect to see continued improvements in the availability and quality of environmental data.
Explore more on LAWA
Looking at monitoring site data from individual lakes provides further context alongside information on lake type, size, depth, mixing pattern, and ecological condition.
To view a specific site:
-
On a desktop or tablet: click a site dot on the map on the LAWA homepage
-
Or navigate by region > catchment > site
For more detail, the organisation responsible for monitoring a site can provide additional insights into the data and information shown.